Friday, finished the periodic verification tests of our AMCA 210 Chamber fig. 15 / ISO 5801, we did the analysis of the results to verify the state of the wind tunnel. The data, as always, are extraordinarily precise and repeatable.
We wanted to try a fan by changing the configuration and the number of open nozzles. As you can see from the attached test file, the result is once again extraordinarily precise.
To better interpret the file, I indicate the parameters of the tests, which you can however find in the attached file:
"Prova n.8": Test performed with 3 open nozzles with a diameter of 225 mm all located in the center of the test Chamber.
"Prova n.9": Test performed with 2 open nozzles with a diameter of 225 mm, positioned in the center of the test Chamber.
"Prova n.11": Test performed with 3 open nozzles of 225 mm diameter, adjacent to the walls of the test Chamber.
Looking at the data of the flow rate and pressure graphs:
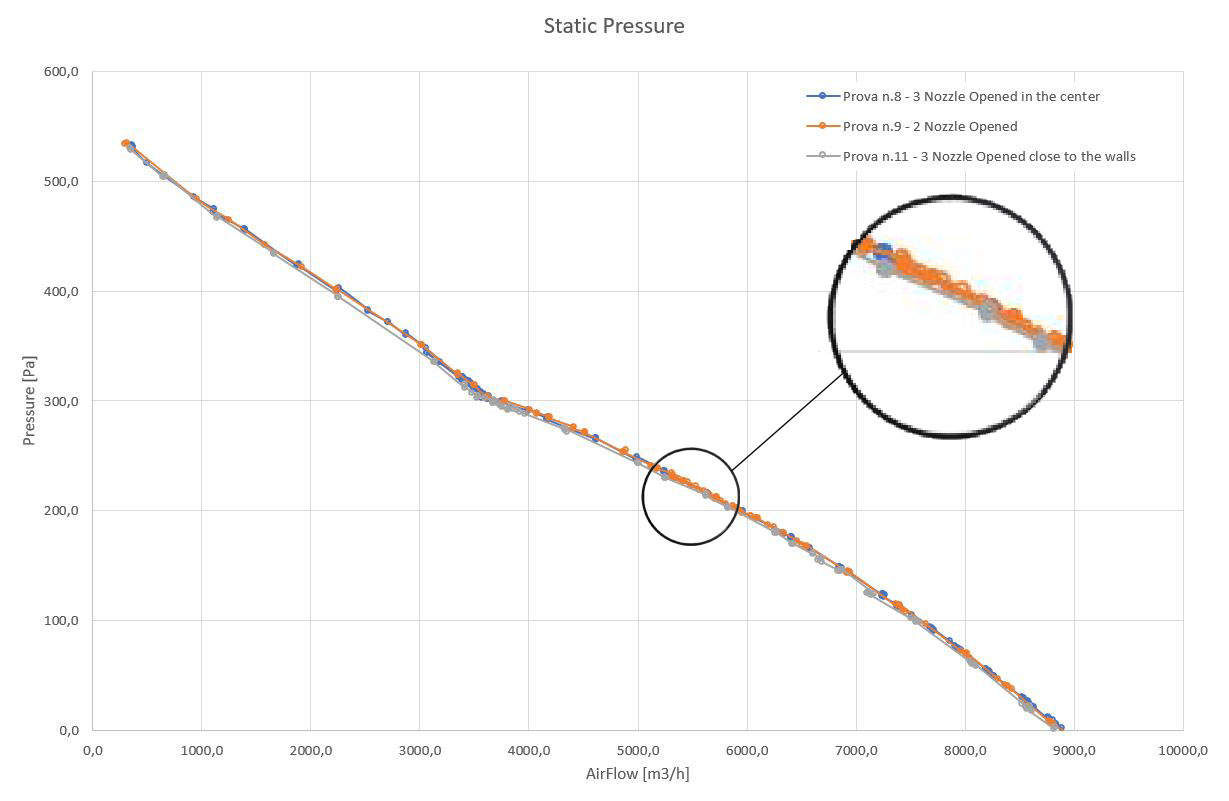
it seems that the results are not so exceptional. In fact, from the flow rate and static pressure graph, the performance obtained during the "Prova n.11" is slightly discouraged from the previous ones, it seems that the fan is less performance, but looking at the speed graph:
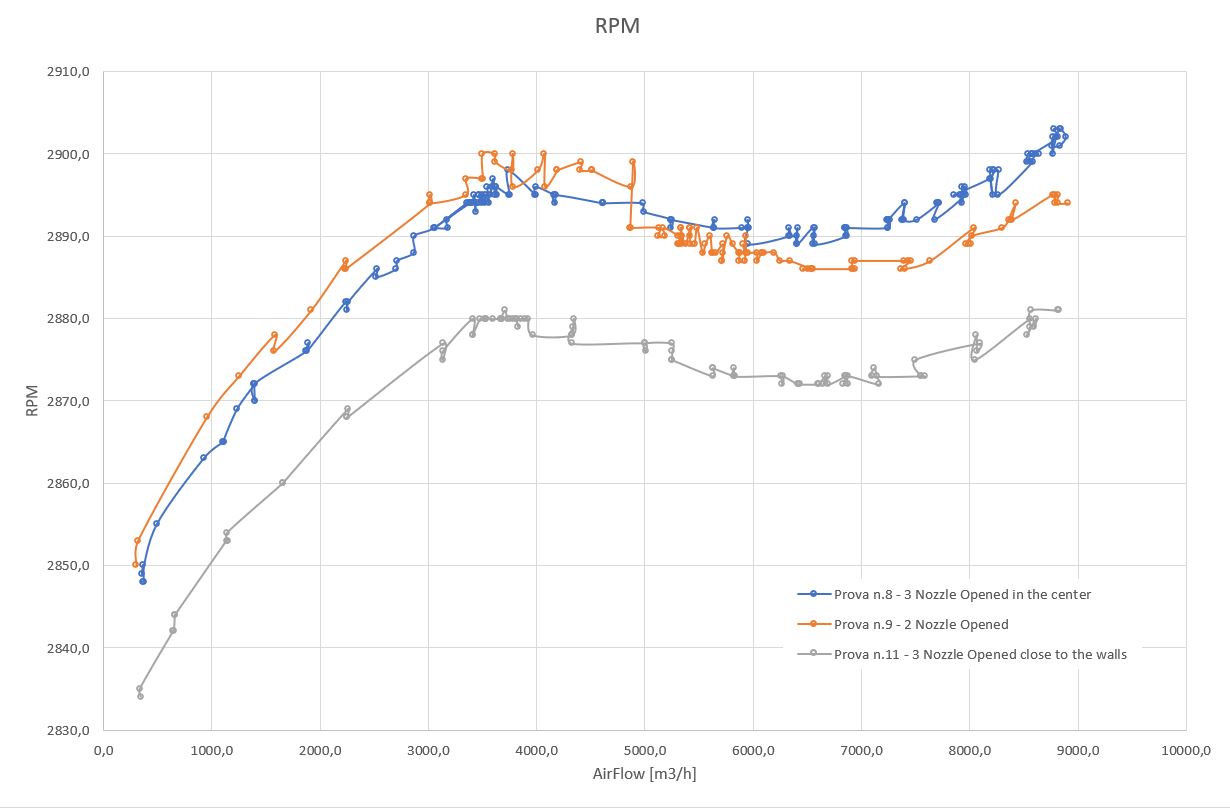
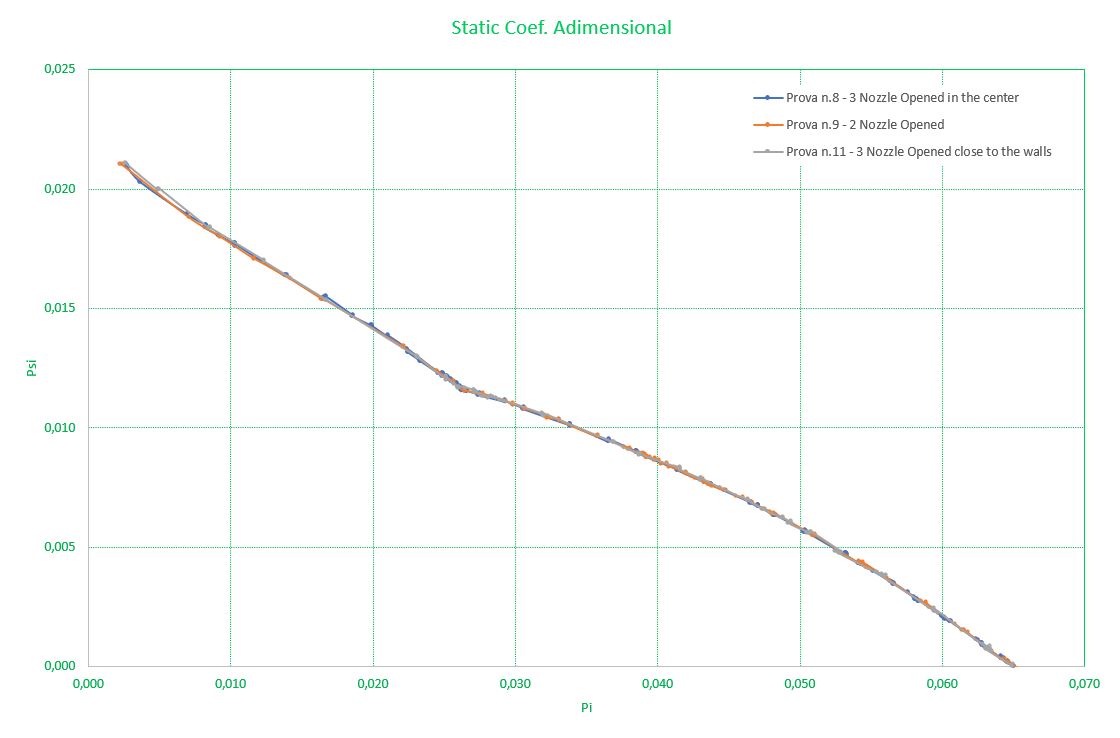
it shows that the fan, due to the heating of the engine, has reduced the rotation speed, and if we look at the adimensional "Psi" graphs:
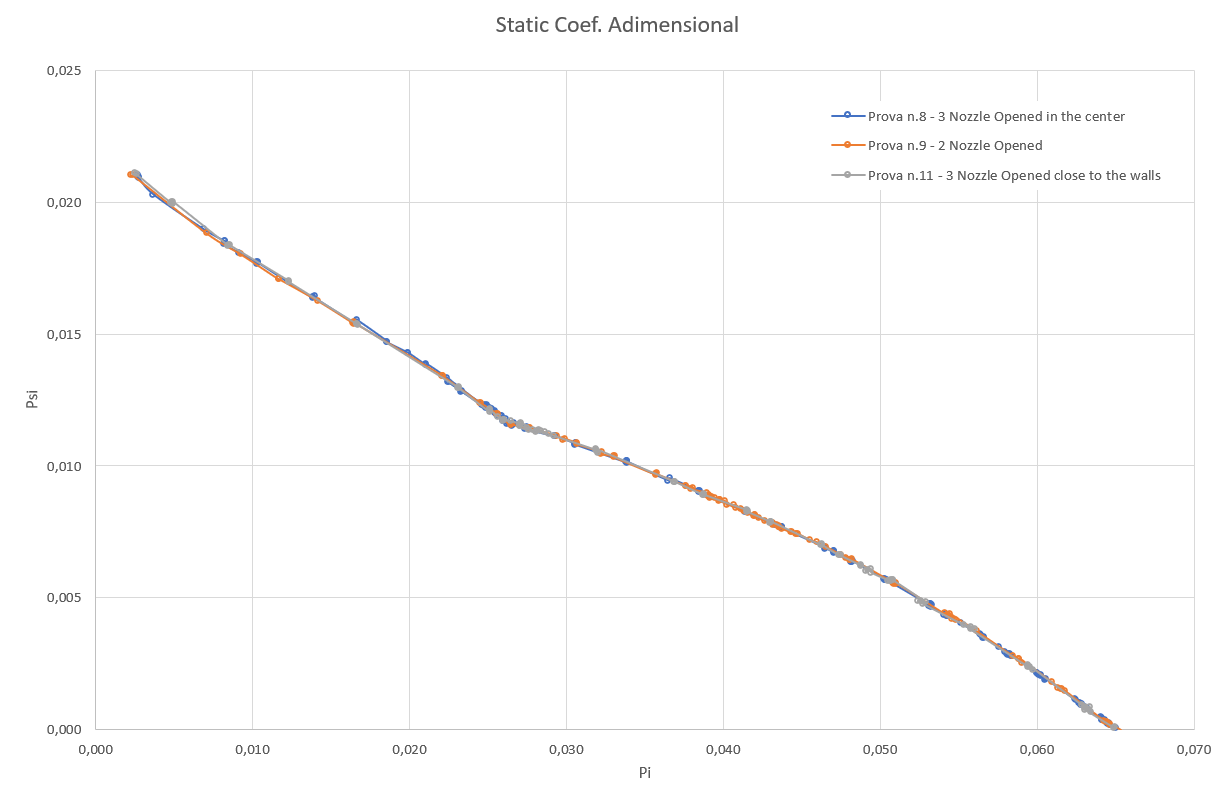
we can verify that the results of all the tests are exactly repeatable regardless of the configuration of the wind tunnel.


RECOV S.R.L a socio unico - via A. Volta, 4 20834 Nova Milanese (MB) Italia - P.IVA 09003590966 - Cod. Dest. M5UXCR1